

10 Pillars Analysis on FAANG
10 Pillars Analysis on FAANG
Is it time to buy more Big Tech after yesterday's pullback?

FAANG is an acronym given to stocks of the 5 most prominent American technology companies, including Facebook, Amazon, Apple, Netflix and Alphabet (formerly known as Google). Also known as Big Tech, these companies have been under the spotlight for most of the past decade due to their stellar growth and their stratospheric combined market cap of nearly $5.6 trillion as of Aug. 13, 2020.
However, being among the largest companies in the world has raised concerns that FAANG stocks may be in the midst of a bubble. As long-time tech investors myself, I believe most of their growths are justified by their exceptional financial and operational performance in recent years.
Let’s take a quick look at their fundamentals using our 10 Pillars Analysis* to see how overvalued each of these companies is today. Before we start, I am going to introduce to you what exactly is 10 Pillars Analysis.
*Please note that the 10 Pillars Analysis only gives us a bird's-eye view of the company’s financial statements. It doesn't substitute further due diligence and research before making any investment decisions.
🤷🏻♂️ HOW DO THE 10 PILLARS WORK
10 Pillars Analysis is a quick way to work out a company’s fundamentals before doing any more due diligence on a particular company. In the end, it also gives you a rough idea of how much a company is roughly worth based on its 5-year-average of free cash flow. This is only one of the many ways to figure out a company’s intrinsic value, and it is subjected to changes in the future.
💰What are the 10 Pillars?
#1 Profit margin - Profit margin measures a company’s profitability. e.g. 10% profit margin means a company generates a net income of $0.10 for each dollar of sales.
#2 Return on invested capital (ROIC) - ROIC measures how well a company is reinvesting its capital to generate profits. i.e. If you hold a stock through its ups and downs over the longest period of time, your return should roughly approximate the business’s ROIC. i.e. It tells you if you should overpay for a company.
“The higher return a business can earn on its capital, the more cash it can produce, the more value is created. Over time, it is hard for investors to earn returns that are much higher than the underlying business’ return on invested capital.” Warren Buffett
#3 Price to earnings ratio (P/E) - P/E multiples measures a company’s relative value to its earnings per share. In other words, high P/E can either mean that the stock is overvalued or investors are expecting high growth rates in the future.
#4 Revenue - Increasing revenue in the last 5 years shows that the company is growing.
#5 Net income - Positive net income growth means that the company is increasingly profitable. Net income is whatever that is left for the business after deducting its total expenses from its revenue.
#6 Basic average shares - Basic average shares outstanding are the average number of shares held by the investors over a specific reporting period. Ideally, we would much rather see basic average shares decrease over time, which would mean the company had been buying back their shares, which only increases the value of the slice of pie each investor holds; this happens a lot when a stock is at a discount. However, on the other hand, when a stock is overvalued, most companies would issue more shares to raise capital at a premium.
#7 Current asset vs current liabilities - Higher current assets than current liabilities mean that a company has a strong balance sheet and can pay all its debts. Oppositely, a company with higher liabilities and assets may be on the cusp of going out of business when major shortcomings happen, e.g. COVID-19 pandemic.
#8 Free cash flow (FCF) Growth - FCF is one of the most important ways to measure a company’s profitability because what matters is how much cash does a company has at the end of the day (after deducting capital expenditure from a company’s total operating cash flow). FCF can be used to generate additional non-asset-related growth by:
pay dividends
buyback of shares
make an acquisition
pay down debt
FCF = Cash from operations - Net change in capital expenditure#9 Market cap / FCF (or commonly called Price to FCF) - Price to FCF allows us to measure a stock’s valuation with its FCF, similar to the common practice of measuring a company’s valuation using the P/E ratio. However, the former is much preferred because accounting treatments can easily manipulate earnings (E). Ideally, we would aim for Price to FCF multiples of 20x for fast-growing companies to make sure we are not overpaying and at the same time, that leaves us with a reasonable margin of safety.
#10 Free cash flow more than Dividend - If a company does pay a dividend, we want to make sure that the company can afford to pay its dividend for the foreseeable future; otherwise, there is a possibility that the company might slash its dividend yield in the near future which can cause its stock price to tumble. See Lumen, for example.
🔍 LET’S LOOK AT FAANG
Now that we are familiar with the 10 Pillars Analysis let’s take a quick look at the FAANG stocks. (Note: All the data presented below are retrieved on 02.05.21)
1. Facebook 🌏
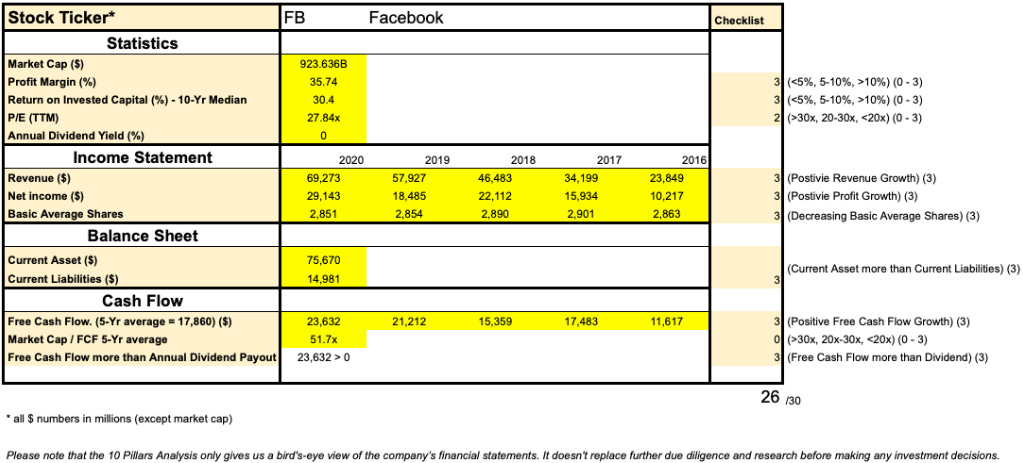
✅ Facebook is undoubtedly fast-growing throughout the past 5 years and beyond in terms of revenue, net income and free cash flow.
✅ Great ROIC, which means it makes sense to overpay for the company with a multiple of around 30x P/FCF multiples
✅ Facebook had been buying back shares consistently throughout the past 5 years.
✅ Solid balance sheet: 5 times more assets than liabilities
❌ It is hard to justify paying 51.7x Price to 5-Yr-Average FCF multiples. By taking the 2020 FCF, however, we will get a Price to FCF multiples of 39.1x. Still, pretty overvalued.
10 Pillars Score: 26/30
My verdict: Facebook is a fantastic company to invest in but not at today’s price point. To give us a reasonable margin of safety, I would only consider buying some when the price does pull back at least 15% from today’s price. i.e. Buy at $276.
2. Amazon 🛍

✅ Strong, steady growth in revenue, net income and free cash flow in the past 5 years
✅ ROIC (13.3%) is okay for a tech company ( >10% is expected for a growing tech company). Not high enough to justify overpaying a premium.
✅ Assets are more than liabilities
❌ Lacklustre profit margin
❌ Skyhigh P/E multiples (66x) and P/FCF multiples(92x) - astronomically overpriced
❌ The company had been issuing more shares every year
10 Pillars Score: 20/30
My verdict: Amazon is a great company; however, today’s price point is stratospherically overvalued. One of the few things driving investors’ bullish sentiment is the expectation of growths in Amazon Web Services and Advertising. However, it is important to note that today’s high valuations had already taken all the possible FUTURE growths into account. To pay such a premium TODAY, it will take years for the company to reach TODAY’s valuation, assuming it will meet the expectations consistently.
I am aware that valuations metrics (e.g. P/E) do fall to a more realistic range as a company reports greater earnings over time, but that would only be true if the price does remain relatively stagnant for the valuations to catch up. I would wait for at least a 15-20% pullback from today’s price point before buying more.
3. Apple 📱
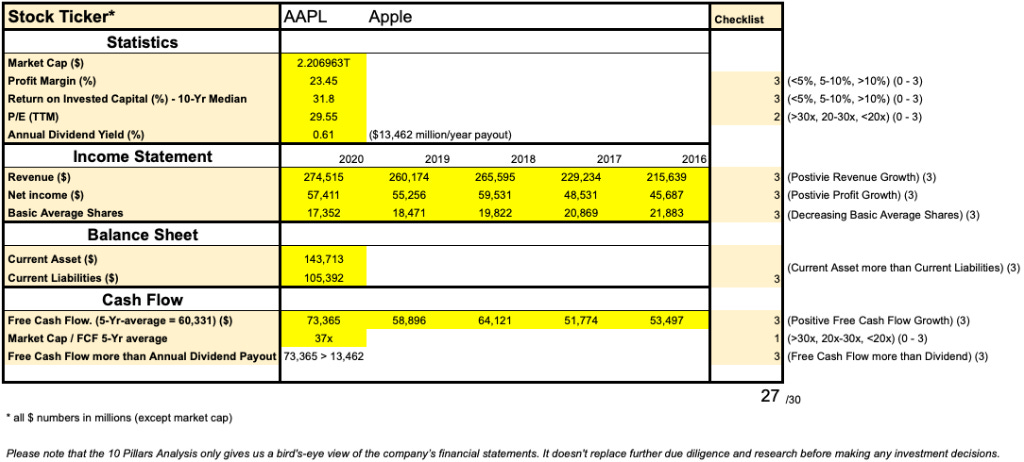
✅ Like Facebook, Apple has an amazing track record of steadily growing its revenue, net income, and FCF.
✅ Superb ROIC of 31.8%, again it totally makes sense to overpay for a company that can generate a great return by reinvesting its capital.
✅ On top of that, it had been buying back shares consistently throughout the past 5 years.
✅ Great balance sheet: 1.5 times more assets than liabilities
10 Pillars Score: 27/30
My verdict: To be honest, I would 100% be comfortable buying more Apple stocks and holding them for a very long time only if its valuation gets lower than it is today. Note that I have been using the 5-year-average FCF in calculating price to FCF metric to be conservative with our predictions, hence the Price to 5-Yr-Average FCF multiples of 37x. However, if we substitute the 5-Yr-average FCF by its trailing-twelve-months FCF: $90,473, its price-to-FCF multiples are about 24x. Here’s what my plan is, 20x price-to-FCF multiples will be the ultimate sweet spot; however, it is hard to imagine that day will ever come given the current low-interest-rate environment we are in today. So, I would buy some at the $125 level, followed by more at $120, $115 and so on, only if my dream does come true.
4. Netflix 🎞

✅ Strong, steady growth in revenue, net income and free cash flow in the past 5 years
✅ ROIC (11.8%) is more than the 10% ( >10% is expected for a growing tech company); Not high enough to justify overpaying a premium.
✅ Assets are more than liabilities, although not by much
❌ Higher-than-Amazon P/E multiples (62x) and P/FCF multiples(118x) - absurdly overpriced
❌ The company had been issuing more shares every year
10 Pillars Score: 20/30
My verdict: Netflix had always been one of the most overhyped stocks in the tech space, especially in the last 12 months. We had seen a remarkable surge of new subscribers in the service during the pandemic era; however, expectedly, it had struggled to keep up with the same growth rate as we slowly come out of the pandemic. With that, it is pretty clear that there is no reason to pay such a premium for the company.
5. Alphabet (Google) ☁️
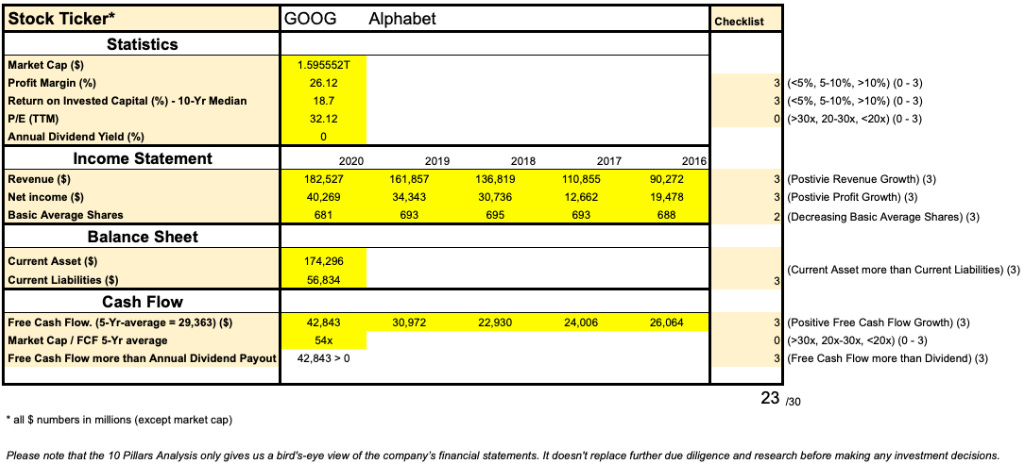
✅ Fluctuating growth in revenue, net income and free cash flow in the past 5 years, but ultimately a growing pattern overall.
✅ ROIC (18.7%) is great but not as remarkable when compared to Apple and Facebook.
✅ The company had been buying back shares in recent years
✅ Great balance sheet: It has more than 3 times assets than liabilities
❌ High P/E multiples (32x) and P/FCF multiples(54x) - could be better
10 Pillars Score: 23/30
My verdict: Google is certainly on the overvalued side when it comes to fundamentals analysis, at least for now. Google is one of the few companies out there that truly touch lives, and there is no doubt that Google is more than likely to keep growing from here on. If you can quit looking at the stock price after buying it and come back after 10 years, you would probably still do fine. However, I see some potential for more pullback as interest rate hikes up in the near future. When that happens, it is probably a good buying opportunity for all tech enthusiasts, myself included.
Do you like my quick 10-pillars analysis and would you use it on your own research?
Do you have any company that you would like me to analyse next?
Please leave a comment to let me know.
✨✨ To gain access to the spreadsheet, download it here for FREE ✨✨
If you enjoy this post or Stock Investing on FIRE as a whole, please give it a ❤️ and recommend it to your friends to spread financial wellness to more people.
Best, HaoNing